Internet in Africa By Each Country
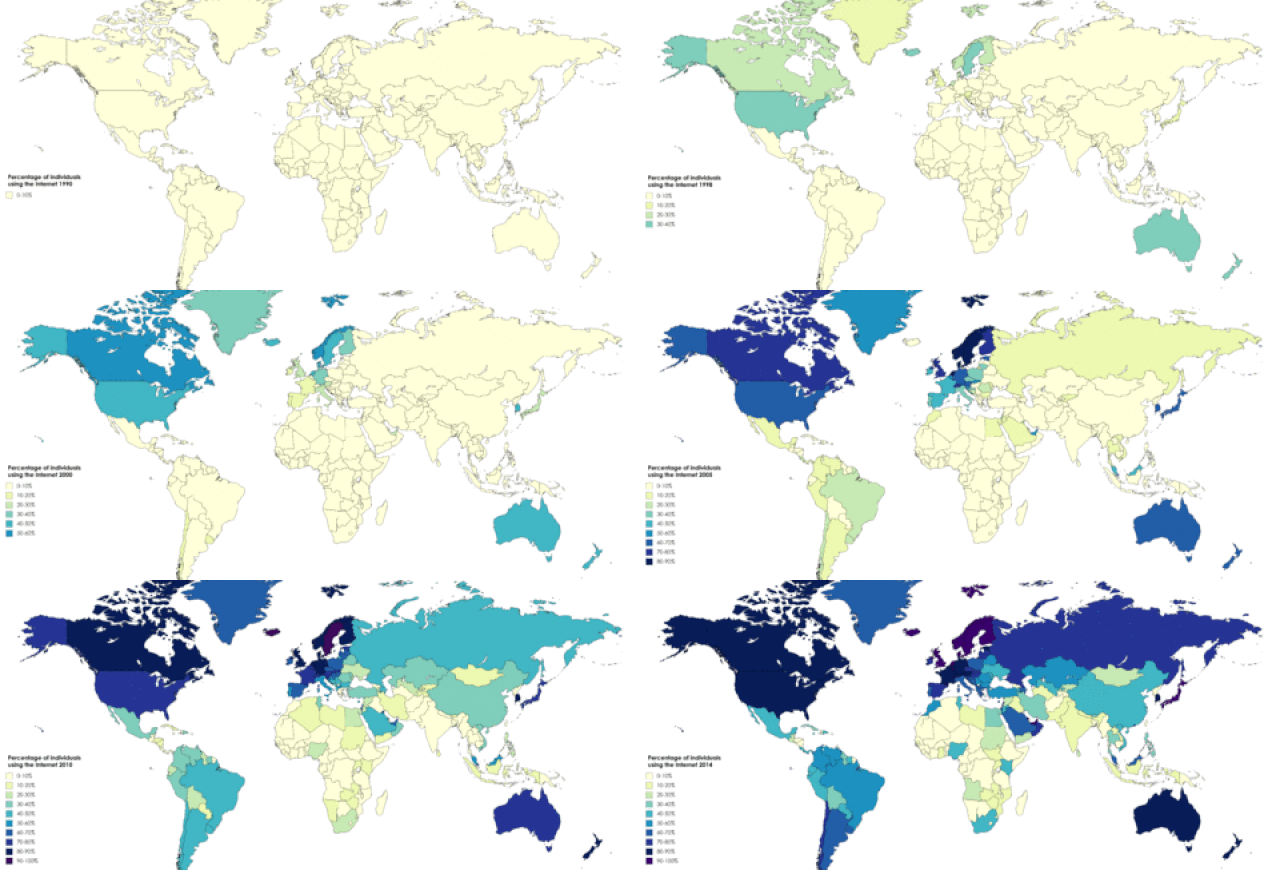
Internet access and use in Africa has grown faster than anywhere else on the planet in the last decade increasing by an astonishing 2,527.4 % compared with just 151.7 % in North America. Translated into actual numbers there were 4,514,400 internet users in Africa at the end of 2000 compared with 634,863,323 today out of as total continental population of 1,373,486,514, however access varies widely from just 7.7% in Angola to 84.8% in Algeria. The data table below shows a breakdown of internet access across the countries of Africa where these wide discrepancies can be seen.
|
Country |
Population |
Internet
Access |
As a %
of Population |
Facebook
Subscribers |
|
Algeria |
44,616,6247 |
37,836,425 |
84.8% |
25,920,000 |
|
Angola |
33,933,610 |
8,980,670 |
7.7% |
2,604,000 |
|
Benin |
12,451,040 |
3,801,758 |
30.5% |
1,740,000 |
|
Botswana |
2,397,241 |
1,160,000 |
48.3% |
1,157,000 |
|
Burkina Faso |
21,497,096 |
1,606,122 |
13.1% |
716,400 |
|
Burundi |
12,255,433 |
1,606,122 |
13.1% |
716,400 |
|
Cameroon |
27,224,265 |
9,158,422 |
33.6% |
4,443,000 |
|
Cape Verde |
561,898 |
352,120 |
62.71 % |
303,100 |
|
Central African Republic |
4,919,981 |
557,085 |
11.3% |
125,600 |
|
Chad |
16,914,985 |
2,237,932 |
13.2% |
561,500 |
|
Comoros |
888,451 |
209,800 |
23.6% |
209,800 |
|
Congo, Democratic Republic |
92,377,993 |
16,355,917 |
17.7% |
4,485,000 |
|
Congo, Republic of (Congo-Brazzaville) |
5,657,013 |
893,700 |
15.8% |
893,700 |
|
Cote d'Ivoire (Ivory Coast) |
27,053,629 |
12,253,653 |
45.3% |
6,200,000 |
|
Djibouti |
1,002,187 |
548,832 |
54.8% |
276,600 |
|
Egypt |
104,258,327 |
54,741,493 |
52.5% |
51,420,000 |
|
Equatorial Guinea |
1,449,896 |
362,891 |
25.0% |
130,000 |
|
Eritrea |
3,601,467 |
248,199 |
6.9% |
8,000 |
|
Eswatini (Swaziland) |
1,172,362 |
665,245 |
56.7% |
358,100 |
|
Ethiopia |
117,876,227 |
21,147,255 |
17.9% |
7,393,000 |
|
Gabon |
2,278,825 |
1,367,641 |
60.0% |
840,000 |
|
Gambia |
2,486,945 |
472,550 |
19.0% |
468,000 |
|
Ghana |
31,732,129 |
14,767,818 |
46.5% |
8,323,000 |
|
Guinea |
13,497,244 |
2,551,672 |
18.9% |
2,310,000 |
|
Guinea-Bissau |
2,015,494 |
250,000 |
12.4% |
140,000 |
|
Kenya |
54,985,698 |
46,870,422 |
85.2% |
10,830,000 |
|
Lesotho |
2,159,0779 |
682,990 |
31.6% |
490,900 |
|
Liberia |
5,180,203 |
760,994 |
14.7% |
658,200 |
|
Libya |
6,958,532 |
5,857,000 |
84.2% |
5,857,000 |
|
Madagascar |
28,427,328 |
2,864,000 |
10.1% |
2,864,000 |
|
Malawi |
19,647,684 |
2,717,243 |
13.8% |
637,600 |
|
Mali |
20,855,735 |
12,480,176 |
59.8% |
2,033,300 |
|
Mauritania |
4,775,119 |
969,519 |
20.3% |
927,300 |
|
Mauritius |
1,273,433 |
919,000 |
72.2% |
919,000 |
|
Morocco |
37,344,795 |
25,589,581 |
68.5% |
21,730,000 |
|
Mozambique |
32,163,047 |
6,523,613 |
20.3% |
2,756,000 |
|
Namibia |
2,587,344 |
1,347,418 |
52.1% |
792,000 |
|
Niger |
25,130,817 |
3,363,848 |
13.4% |
577,800 |
|
Nigeria |
211,400,708 |
154,301,195 |
73.0% |
31,860,000 |
|
Rwanda |
13,276,513 |
5,981,638 |
45.1% |
806,200 |
|
Sao Tome and Principe |
223,368 |
63,864 |
28.6% |
60,800 |
|
Senegal |
17,196,301 |
9,749,527 |
56.7% |
3,802,000 |
|
Seychelles |
98,908 |
71,300 |
72.1% |
71,300 |
|
Sierra Leone |
8,141,343 |
1,043,725 |
12.8% |
833,400 |
|
Somalia |
16,359,504 |
2,089,900 |
12.8% |
2,089,900 |
|
South Africa |
60,041,994 |
34,545,165 |
57.5% |
24,600,000 |
|
South Sudan |
11,381,378 |
900,716 |
7.9% |
436,600 |
|
Sudan |
44,909,353 |
13,124,100 |
29.2% |
1,300,000 |
|
Tanzania |
61,498,437 |
23,142,960 |
37.6% |
5,223,000 |
|
Togo |
8,478,250 |
1,011,837 |
11.9% |
860,500 |
|
Tunisia |
11,935,766 |
8,170,000 |
68.4% |
8,170,000 |
|
Uganda |
47,123,531 |
18,502,166 |
39.3% |
3,328,000 |
|
Western Sahara |
611,875 |
28,000 |
4.6% |
27,000 |
|
Zambia |
18,920,651 |
9,870,427 |
52.2% |
2,543,000 |
|
Zimbabwe |
15,092,171 |
8,400,000 |
55.7% |
1,303,000 | |


